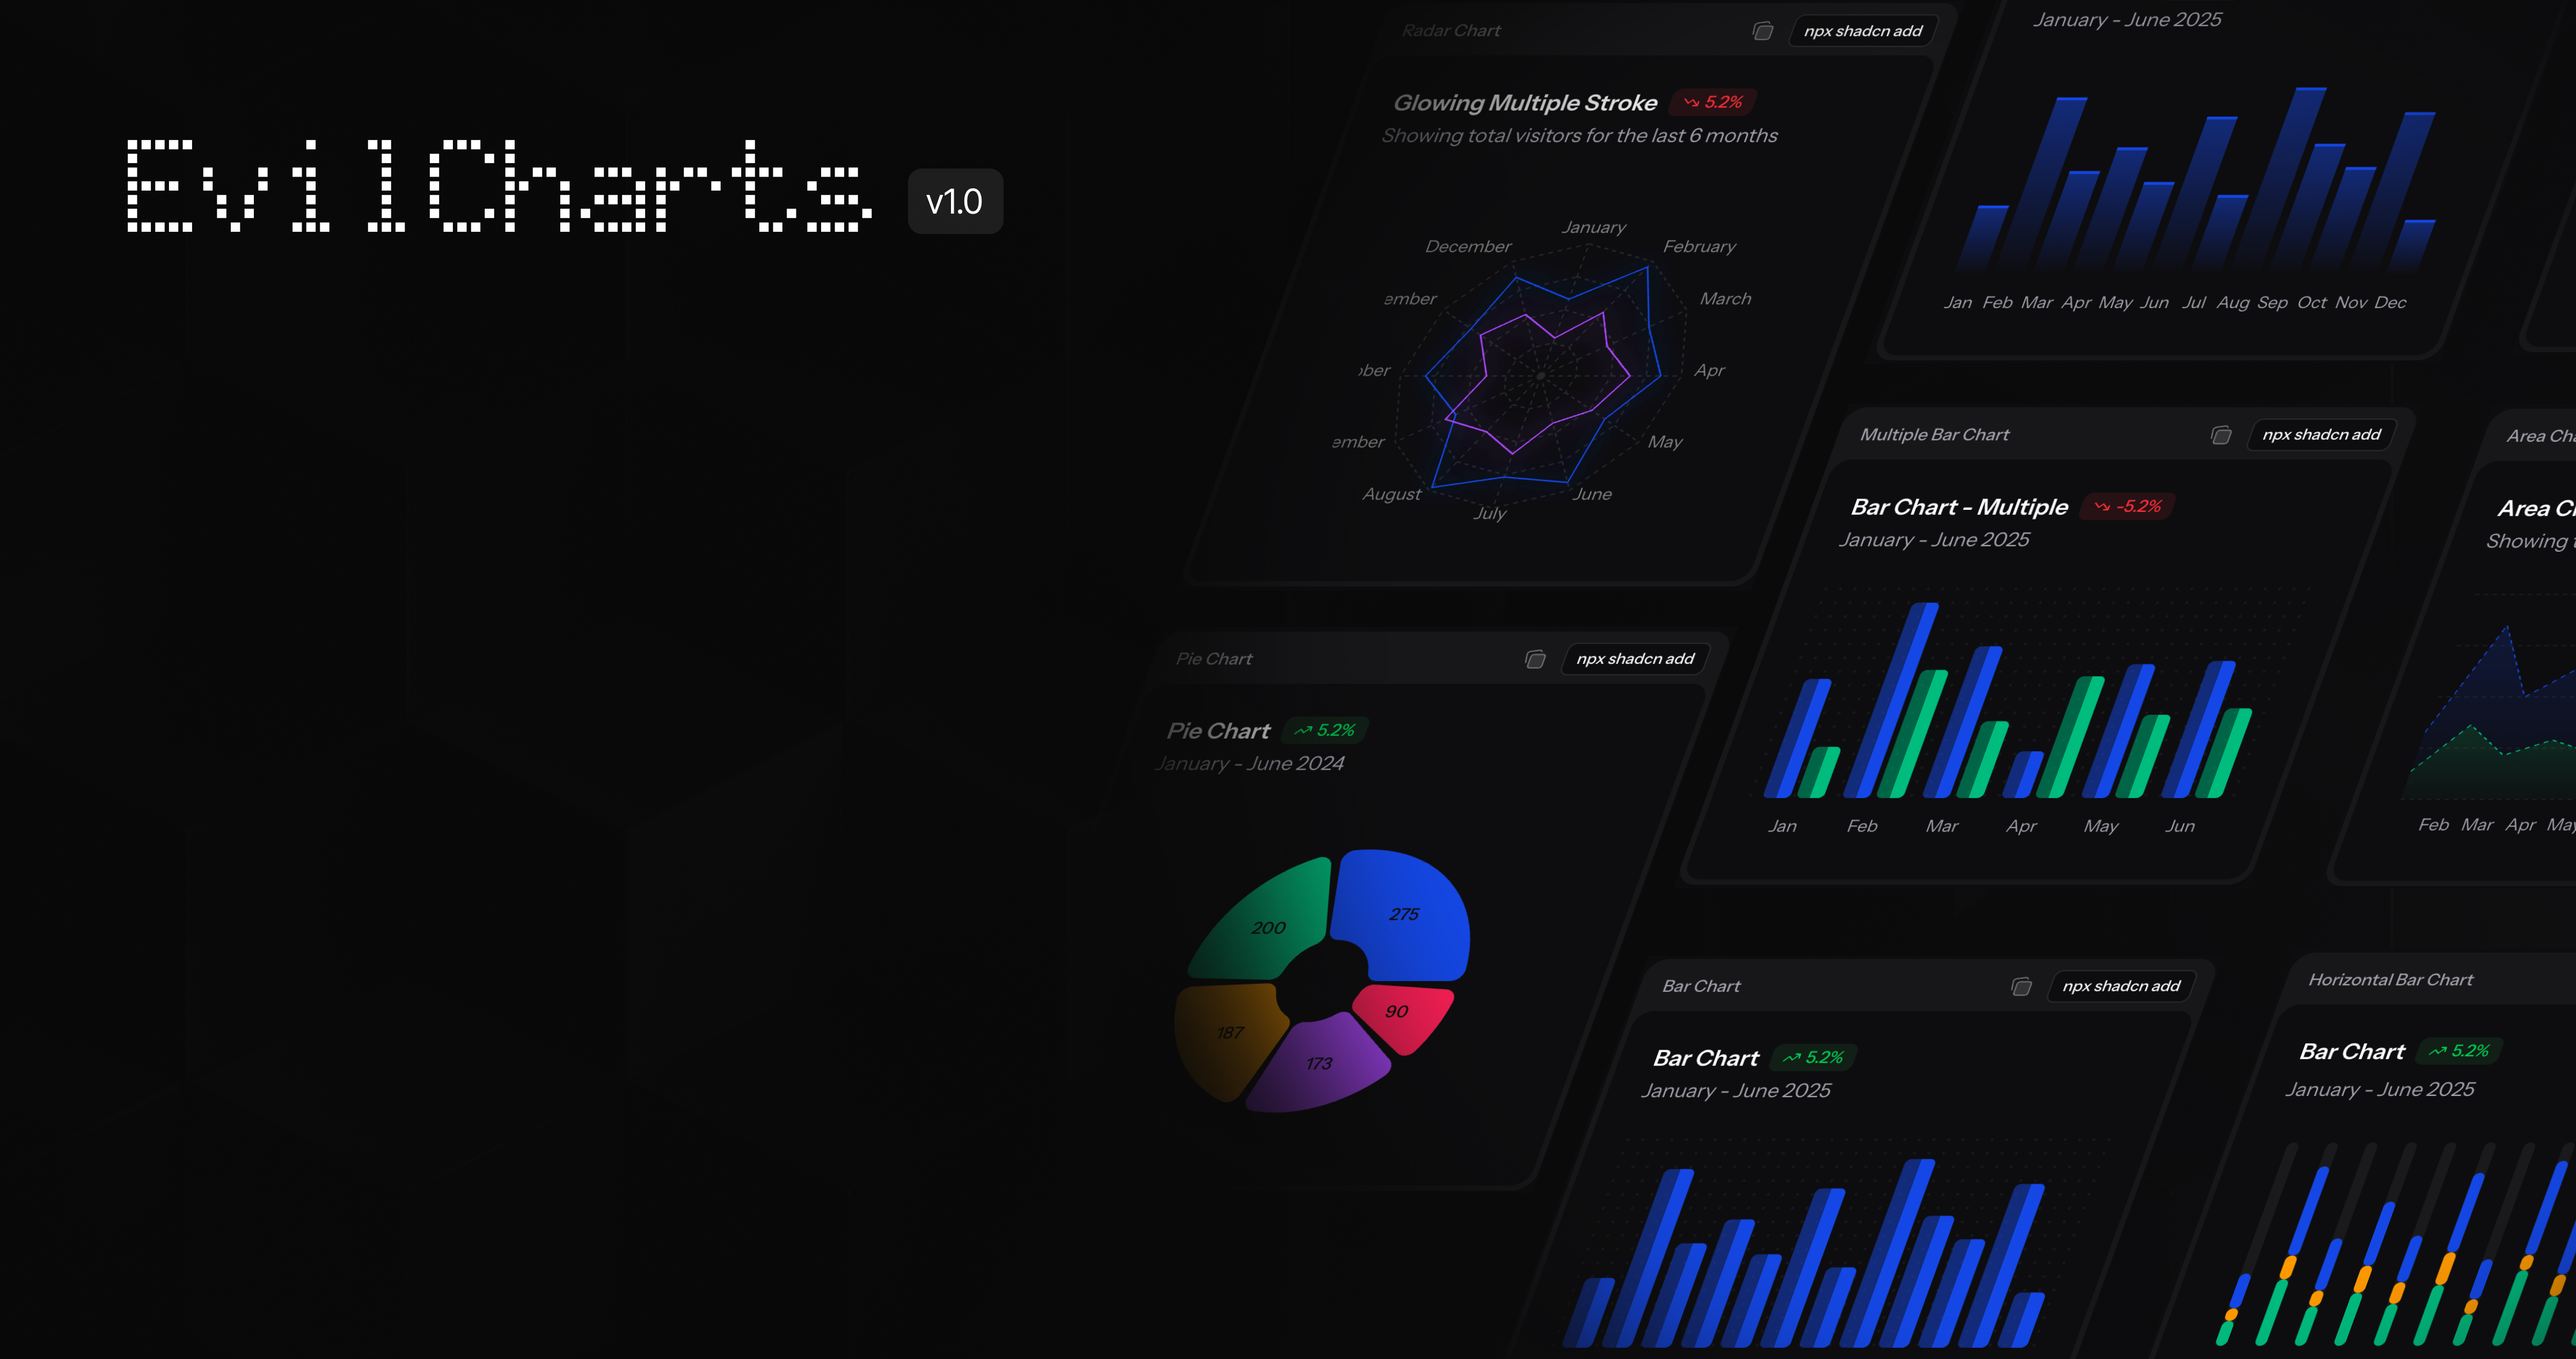
Evil Charts
Evil Charts is a library of beautiful charts components that are easy to use and customize. It is built with Tailwind CSS and React. Built on top of shadcn/recharts.
About Evil Charts
Evil Charts is a meticulously crafted components built with Shadcn UI components. This components showcases modern web design while maintaining the highest standards of accessibility and user experience.
Technology Stack & Implementation
Built with a modern stack including React, Evil Charts leverages react, ui to deliver exceptional performance and developer experience. The implementation demonstrates best practices in components development.
Design Philosophy
The design of Evil Charts exemplifies attention to detail with carefully considered typography, spacing, and color schemes. Every component is crafted to provide intuitive interactions while maintaining visual consistency throughout the interface.
Why We Featured This
We featured Evil Charts in our collection because it represents exceptional components design and implementation. The project serves as an inspiring example of what's possible when combining Shadcn UI's flexibility with thoughtful design decisions and modern development practices.
Ready to explore Evil Charts ?
Visit the live website to experience all features and see the implementation in action.